
Bootstrapping Oneway Analysis of Variance


All of the other bootstrapping procedures that I have discussed has focused primarily on parameter estimation by way of confidence intervals. Although the confidence intervals do provide an hypothesis test, that is not the primary purpose. When it comes to the analysis of variance, hypothesis testing is the goal, rather than the by-product. In fact, I had to debate with myself whether to even leave this section, and the accompanying procedure, in these pages. Although the approach seems sound, I am far more comfortable with the randomization test, to be discussed shortly. I suspect that I am leaving this in for the wrong reason; viz. I went to all the trouble to write this.
Example
I'll use the example of a study of Post Traumatic Stress Disorder (PTSD) in rape survivors. This study was carried out by Foa, Rothbaum, Riggs, and Murdock (1991), as part of a long series of studies that Foa has conducted on this topic. Each of the participants completed a symptom inventory at the start of treatment, and again at the end. We will use the data from the end of treatment. There were four conditions. Group SIT (Stress Innoculation Therapy) learned techniques for dealing with stress. Group PE (Prolonged Exposure) reviewed the rape incident in their heads over and over again, until it lost some of its negative valence. Group SC (Supportive Counseling) was a group that just received standard counseling, and Group (WL) was a waiting list control group. The data for this example have been created to have the same means and standard deviations of Foa's data, and can be obtained at Foa1way.dat.
The means and standard deviations are given below.
Group n Mean St. Dev. SIT 14 11.07 3.95 PE 10 15.40 11.12 SC 11 18.09 7.13 WL 10 19.50 7.11
A standard one-way analysis of variance on these data would produce F = 2.046, p = .039, which would lead us to reject the null hypothesis. However, with very little data in each cell, we don't really have a good way to convince ourselves that normality is a reasonable assumption. At best, all we can say is that the data are not so extreme as to lead us to believe that they are not normally distributed. However, we can use the bootstrap procedure to avoid having to make that assumption, though it will come at some small cost. (I should also point out that there is a problem with homoscedasticity (compare the variances of Groups SIT and PE.)
Bootstrapping an analysis of variance
If we are willing to assume that the data we have are a reasonable representation of the populations from which they were drawn, then we can use those data to reproduce the population under the null, and then draw bootstrapped samples from that population. Notice, however, that we have clearly made an assumption. We have assumed that the sample data reflect the population. That is just as much of an assumption as the assumption of normality (which we did not choose to make). This is an important point to keep in mind, especially with small samples.
To create a bootstrap solution, we assume that, under the null hypothesis, treatments had no effect on symptom scores. (You may notice that I have been a bit vague in stating that assumption, but I'll explain why later.) If the treatments had no effect, then we can combine all 45 sample observations into one large pseudo-population, and create a bootstrapped sample from that. Thus we will sample, with replacement, 45 scores from the pseudo-population. The first n1 = 14 scores will be assigned to the SIT group, the next 10 scores to the PE group, and so on. Notice that this assignment of scores is done under the null hypothesis, so the results we obtain will represent results we would would expect if the null were true.
We will repeat this procedure B times, where B is the number of bootstrapped samples we want, which will usually be on the order of 1000 or more. (The program runs so quickly that there is little cost to setting B = 5000, which is what we will do here.)
When we were dealing with creating confidence limits on the mean, median, or correlation coefficient, our primary interest was in estimating a population parameter, and the obvious statistic for us to compute was the corresponding mean, median, or correlation coefficient. But we aren't dealing with estimating parameters here, we are looking for a significance test. For that purpose we need to have some statistic that reflects the magnitude of the differences between the groups. If we had just two groups, we could simply record the difference between the two means. But for multiple groups a simple measure like that won't do. We could, however, calculate the sum of squared deviations of group means from the grand mean, and that metric would reflect the differences we are looking for. Alternatively, we could go even further and compute an F statistic for each bootstrapped sample. These 5000 or so F values would represent the sampling distribution of F under the assumption that our pseudo-population reflects the true shape of the single population from which these data are hypothesized to be drawn. (If the null hypothesis is true, all populations are assumed equal, and thus we are really drawing from a single large population.) From that sampling distribution we can evaluate the F obtained for our experimental sample means. I have chosen to use F as the metric, partly because it is a familiar statistic. Keep in mind, however, that I will not compare my obtained F to the tabled sampling distribution of F, but to the sampling distribution that I compute as a result of my bootstrapping. The difference between those two sampling distributions may be minor, if we actually have data from normal populations, or it could be substantial, if we have data from very non-normal or heteroscedastic populations.
Before going further, I'll illustrate the results of applying this procedure to the Foa data. The resulting output is shown below.
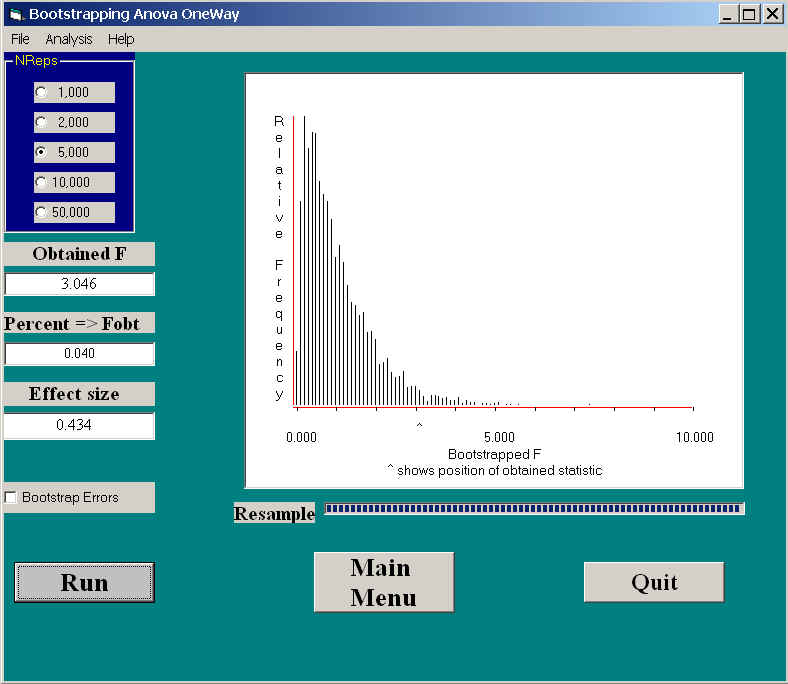
This printout looks quite different from what we have seen for other bootstrap procedures. First of all, the metric used to measure differences is the traditional F, which is plotted on the X axis. These are the F values that we obtained in a situation where the null hypothesis was true. Because we randomly assigned scores to groups (the first 14 bootstrapped observations were assigned to group 1, etc.), the distribution should look a lot like the usual central F distribution, and it does. On the left you see the F value that was obtained for our original sample (F = 3.046). This is exactly the same value that you would get if you ran a traditional analysis of variance. Where we differ from a traditional analysis of variance is in what we do with that F. While the program was computing its 5000 Fs, it kept track of how many exceeded the obtained value of 3.046. It turned out that only 4% of them did (p = .040). Thus, when the null hypothesis is true and we sample from a population that resembles our data, only 4% of the time would we exceed 3.046. Since .04 is less than our traditional .05 level, we will reject H0. We will conclude that there are significant differences due to treatment. (It turns out that a standard analysis of variance applied to these data would produce p = .039, although there are cases where the differences in p values would be much larger.)
But we aren't done. Below the p value in the output you see the effect size = 0.434. This effect size is computed in the standard way, using
where the error term is simply MSerror from the traditional analysis of variance. The purpose of providing d is to give an index of how different the group means are. It is becoming much more common to publish effect size values, and the APA style manual encourages it.
Sampling errors
When we speak about the analysis of variance, we usually talk about
observations, and the distribution of observations. But that is actually a bit
sloppy. When we say, for example, that we assume that observations are normally
distributed, we are really making an assumption about errors being normally
distributed. In other words is it ![]() that
we care about. Since the group mean is a constant for any set of scores in that
group, the distribution of Xij and
that
we care about. Since the group mean is a constant for any set of scores in that
group, the distribution of Xij and ![]() would
look the same. However, there is a problem when it comes to bootstrapping.
Suppose there was a very dramatic difference between Foa's groups, with the two
therapy groups having scores down around 3 or 4, and the two control groups
having scores up around 35 or 30. When we toss all of those values into one
pseudo-population and sample from that, we are sampling from a very weird
population--it would be decidedly bimodal. That pseudo-population doesn't come
close to resembling what we think the population would look like if the null
were true. That creates a problem, because we are sampling from the wrong
pseudo-population.
would
look the same. However, there is a problem when it comes to bootstrapping.
Suppose there was a very dramatic difference between Foa's groups, with the two
therapy groups having scores down around 3 or 4, and the two control groups
having scores up around 35 or 30. When we toss all of those values into one
pseudo-population and sample from that, we are sampling from a very weird
population--it would be decidedly bimodal. That pseudo-population doesn't come
close to resembling what we think the population would look like if the null
were true. That creates a problem, because we are sampling from the wrong
pseudo-population.
The solution to this problem is actually quite simple. We can begin by
calculating the error scores (as ![]() )
and then sample those error scores rather than the raw data. Notice that each
observation is compared with its own mean, not with the grand mean. If the null
hypothesis is true, sampling from this pseudo-population will give us just the
results we want.
)
and then sample those error scores rather than the raw data. Notice that each
observation is compared with its own mean, not with the grand mean. If the null
hypothesis is true, sampling from this pseudo-population will give us just the
results we want.
You will notice in the printout above, there is a check box for doing bootstrap sampling on the errors. I recommend checking that box. In this particular situation it won't make much difference, but in other situations it can.
The null hypothesis
You may have noticed back at the beginning that I was a bit sloppy when it came to specifying the null hypothesis. That sloppiness was deliberate, because I wanted to make a point. If you read much of the literature on bootstrapping and randomization tests, you come up with similarly vague statements. In the traditional analysis of variance, we are usually careful to be specific about the null. We write things like H0: m1 = m2 = ... = mk . That is certainly specific enough. We then go on to make assumptions about homogeneity of variance and normality. But what does it mean to say "treatments don't have an effect?" Often it looks as if the authors are assuming that means don't differ, but not always. For example, Sprent (1998), in a respected text, states :H0: There is no differential response in the measured characteristic between treatments." Efron and Tibshirani (1993) say essentially the same thing by letting one group come from a population with distribution F, and a second group come from a population with distribution G, then stating the null as F = G. Both of these examples are quite different from the null that we are used to. For both Sprent and Efron and Tibshirani, the null could be false because the skewness of F is different from the skewness of G, or the variances of F and G are different, or because their means are different. It is nice not to need to assume homoscedasticity, but the cost of avoiding that assumption is that we toss it into the null hypothesis.
I know absolutely nothing about the treatment of rape victims for PTSD, but I can imagine a scenario that says that the prolonged exposure condition (in which participants constantly review a very traumatic event) would be very helpful to some patients, producing low scores, and really freak out other patients (giving high scores). The net result would be to have no change in the mean, but I can't imagine that people would say that the treatment didn't have an effect, and perhaps end up rejecting the null because the variances are different. And we may not be aware of which characteristic(s) led to rejection.
The reason why this is a critical issue concerns the assumptions we want to make and the conclusions we draw. In a traditional analysis of variance where we assume that the variances are the same and the populations are all normal, a significant result can only signify that the means are different. There is no other difference possible. In bootstrapping, and next in randomization tests, we say that if the null hypothesis is true, the score of 16 could just as easily have come from any group. Well, that's a true statement if "treatments don't affect performance" is taken literally, as it is by Efron and Tibshirani. But what if we really think that we are talking about population means, and believe that other parameters don't matter for such tests? Then a significant difference could reflect unequal variances, unequal shapes, unequal means, or some combination of those.
References
Efron, B. & Tibshirani, R. J. (1993). An introduction to the bootstrap. London: Chapman & Hall.
Sprent, P. (1998). Data driven statistical methods. London: Chapman & Hall.
Last revised: 01/16/2006